Chinese cities & land value

On my last trip to Chinese cities ( Beijing, Chongqing & Guangzhou) last month, l was amazed to see the progress made since my first trip to China in 2008 in their infrastructure particularly transport for their growing cities. It got me thinking how maybe land value capture via taxation or other forms may of helped this huge upgrade to their growing mega-cities. So l got asking around and found out the following. 

In mainland China, all urban land is owned by the state and rural land is collectively owned by villages. So there’s no private freehold landownership in cities, only leasehold “land use rights” (LURs), typically lasting 40–70 years. So clearly they don’t have entities like the Crown Estate and Grosvenor Estate dominating land holdings in their major cities. 

Since the 1990s, local governments in Chinese megacities (e.g. Shanghai, Shenzhen, Beijing, Guangzhou) have financed massive infrastructure expansion primarily through a system often called land finance (土地财政). This is not a classical land value tax like Henry George envisioned, but the economic effect is similar — it captures the increase in land value caused by urbanisation and public investment. This land financing is the core of their urban infrastructure growth. 

The mechanism involves the government converting rural land to urban land use by 
selling or auctioning the land use rights  to developers (residential, commercial, or industrial). Revenue from these sales (and related taxes/fees) is used to fund infrastructure such as subways, roads, and utilities. As infrastructure improves, land values rise, allowing further profitable land leases. This creates a feedback loop where infrastructure investment and land value capture reinforce each other. All of this is largely in response to over the last 30 years, rural migration to Chinese cities being the largest internal migration in human history,  with over 200 million people moving for economic opportunities, which drastically increased the urban population and labor force. 

While China doesn’t have a classical land value tax, it has land-related fiscal instruments that function similarly as outlined in the table below; 

Instrument Description Link to Land Value
Land Use Rights Leasing Fees (土地出让金) One-time payment by developers for the right to use state-owned land for a fixed term Captures full market value at time of sale
Urban Land Use Tax (城镇土地使用税) Annual tax on land area (based on use and location, not market value) Limited progressivity; not a true land value tax
Property Tax (房产税) Pilot programs in Shanghai and Chongqing (based partly on property/land value) Small-scale experiments toward value-based taxation
Land Appreciation Tax (土地增值税) Tax on profit made when land use rights are transferred Captures part of the increase in land value over time


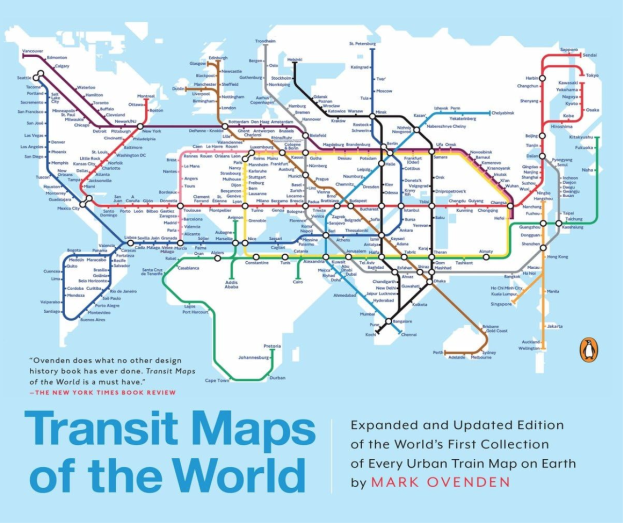
A very good example is Shanghai’s metro system expansion (now one of the world’s largest) was largely financed by selling or leasing land parcels around new metro stations; using the proceeds to finance metro construction; and capturing land value uplift due to improved accessibility. This is essentially a land value capture model, similar in spirit to land value taxation, though implemented via lease auctions and development rights sales rather than annual taxes. 

So in summary the different aspects of their model in comparison to LVT can be highlighted as follows in the table below; 

Aspect Classical Land Value Tax Chinese Land Finance
Legal form Recurring tax on land value One-off lease fees and related taxes
Ownership basis Private land ownership State ownership of land
Timing Annual Upfront (at lease sale)
Economic effect Capture land value increases Capture land value increases
Use of proceeds Public spending, infrastructure Public spending, infrastructure


While Chinese megacities have not implemented a formal “land valuation tax”, they have effectively used state control over land and land value capture mechanisms to finance urban infrastructure — achieving results that mirror the purpose of such taxation. In other words, China has practiced “land value capture without land value tax.”
Time to loss – Winter & Summer time?


As l spend one less hour in bed this morning as the clocks go back for winter, l wonder
 
what the benefits are for it any longerIndeed when at the London Assembly, this issue
 
had been brought up by other Assembly Members. 
 
 
Now the London Assembly does not have a direct role in changing the UK’s daylight
 
saving time (DST) laws, as these are determined by the UK government. The practice of
 
changing clocks for DST continues in the UK. 
 
 
Today we saw the clocks go back one hour from 2am to 1am. This follows the “spring
 
forward”  in March 2025, marking the end of British Summer Time and the return to
 
Greenwich Mean  Time (GMT)  for the winter.  So winter time begins, as the clocks go
 
back one hour on today, October 26, 2025, at 2am, turning back to 1am. This is
 
sometimes referred to as “fall back” and marks the end of British Summer Time. 
 
The clocks will “spring forward” again on March 30, 2025, when they will jump from 1am
 
to 2am, as winter time ends. 
 
 
Whilst the London Assembly is the UK’s local government body for London and does not
 
 
have the authority to change the UK’s national time laws. It can, however, debate and
 
 
advocate for changes, and has been involved in discussions on the topic in the past. 


There is no recent London Assembly motion to end summer and winter time (daylight

saving), but there is a 2019 document from the Greater London Authority (GLA) that

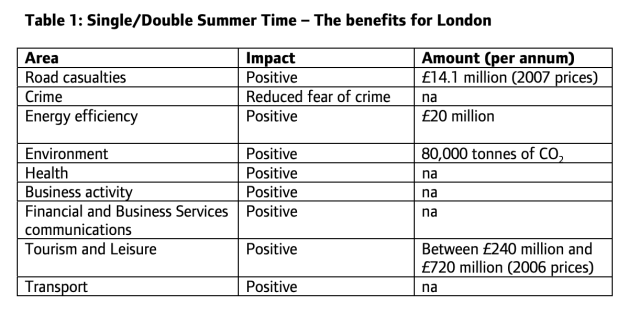
discusses the  potential move to Single/Double Summer Time (SDST) and its implications

for London. The GLA  document highlights potential benefits and challenges, such as

fewer casualties from more rest  but disorientation for drivers from earlier darkness and

environmental, 80,000 tonnes of CO2 reduction annually. 

An analysis of the GLA Economics document called – Single/Double Summer Time: The

Time is Right for London  gives analyses of the theoretical implications of moving

to SDST, which would mean canceling the clock change in October and keeping the clocks

permanently on GMT+1 throughout the year.

For example on the transport front, increased rest for drivers might lead to fewer

accidents. Yet we have the challenge that the sudden onset of darkness an hour earlier

in the evening  during the winter could disorient drivers and make casualties more likely.

Transport timetables would require adjustment.

While there is no specific recent “motion” about ending summer and winter time, the

document serves as a policy analysis that could inform future discussions or motions by

Assembly members and Londoners more critically. 

Boris Johnson owes the Bangladeshi community an apology

This week we heard the previous PM Boris Johnson, say that when he was Mayor of London there were second and third generation Bangladesh children who could not speak English. Nothing could be further from the truth, given all of them would have attend primary and secondary school in the UK.

Boris Johnson was quoted as saying on the Telegraph TV channel “When I was running London it was disgraceful. There were parts of London where the Bangladeshi community, second or third generation were not speaking English, that was insane” 

The actual reality is that Bangladesh kids are been excelling themselves academically for a number of years now, as the Bangladesh High Commission annual awards for Academic achievement illustrate well. Since 2006, they have been running Outstanding Achievement Award: Since 2006, where the High Commission has annually recognised British-Bangladeshi students for outstanding GCSE and A-Level results. To be eligible, students must be of Bangladeshi origin and have achieved a minimum of 10 “A” grades at GCSE and/or 3 “A” grades at A-level and annually they would find around 100 girls and boys passing with such high colours. 


Furthermore, we also have had academic recognition of these achievements not just
 
from a few but just across the board, as its acknowledged that British Bangladeshis are
 
doing astonishingly well as reported in magazines like the Economist for a number of
 
years now and a long cry from the situation in the 1980s, though good jobs and
 
households riches remain out of reach.  So can the previous Mayor of London & PM,
 
admit he is talking a load of tosh here. He should realise that British Bangladeshi kids
 
are doing very well academically now and apologise to the Bangladeshi community, for
 
saying they children can’t speak English!  Such a slur is totally unacceptable from anyone
 
let alone a previous Mayor of London and PM.


It should also be explained to him, that when he was Mayor of London he did not have any educational responsibilities, so it’s not quite clear how such info could have been made available to him at all.  He’s quite clearly losing it since being out of power now.

Lisson Grove Tower – over development again!

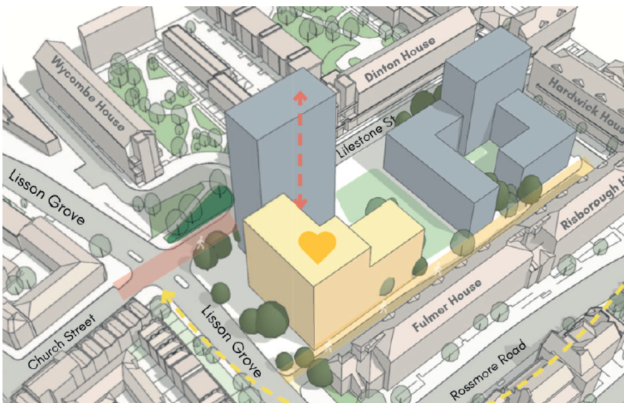
They is a proposal to put up a Tower on the way into Lisson Green Estate on the corner of the Estate designated for redevelopment for Health Services and other uses like Adult Education Services. The latest concerns of regeneration efforts in Church Street Ward of City of Westminster, are best represent in full from the joint letter of a number of residents groups below. 

“Lisson Green Tenants & Residents Association TARA, Four Rivers Tenants and Residents
Association (Four Rivers) and Church Street Ward Neighbourhood Forum (CSWNF)
Statement on the Westminster City Council’s latest ‘Lisson Grove’ development plans

1. We strongly object to the current plans of building a 20+ storey residential tower block right next to a town hall-style community hub on Lisson Green estate.

2. The tower block would create an unacceptably overbearing and oppressive environment for the hub and the nearby blocks of Lisson Green which are seven storeys in height.

3. TARA, Four Rivers and CSWNF support the concept of the Health & Wellbeing Hub between Lilestone Street and Mallory Street fronting Lisson Grove as presented in the Church Street Masterplan and previously being consulted on. We strongly oppose any more additional building developments without due community consultation.

4. These original plans are incompatible with a tower block that would limit the floor area available for the hub. The space between Lilestone Street and Mallory Street should be used in full for the hub to be built less tall than currently proposed.

5. TARA, Four Rivers and CSWNF recognise the need to build as many affordable homes as
possible but they have to be in keeping with the local area and must not reduce the green space available on Lisson Green estate.

6. Currently Greenside provides an ideal combination between a community hall and green outdoor space. This combination must be preserved in any new development. Any new green space must be no smaller than the existing one and suited to accommodating large community events.

7. The proposed residential accommodation to the east of the hub is welcome but should be of the same height as existing Lisson Green blocks.

8. People who are ill and wish to see their GP should not be forced to use the same entrance as the majority of hub users. Medical services should have a separate entrance and be located on the lower floors of the building, certainly not between the seventh and ninth floor.

9. It is essential that the Adult Education Service is also provided with a distinctive and
identifiable character and entrance from the rest of any development.

10. We acknowledge that a state-of-the art Health & Wellbeing hub is a costly investment that residential development has to contribute towards. Those funds should be generated across all development sites in the Church Street area, not primarily one tower block standing next to it.

11. Any new development must contribute towards an environmentally sustainable and
affordable communal heating system for the existing blocks on Lisson Green estate.

12. We have genuine concerns about the general impact of all the housing developments
planned and the tower in particular. The population density of Church Street is already the highest in London. If this population is to be increased, then the wider social and economic needs of the population must be taken into account. This includes the need for social spaces, green spaces and adequate medical, educational and social care services. We wish to see a genuine social regeneration plan sitting alongside the current development plans.” 

So let us now wait and see the response from the Council for what is seen as another overdevelopment in the Church St regeneration efforts of the Council. 

Where are we with UK air pollution?

New DEFRA data shows that, unlike other major UK cities, London met air quality standards for the first time in 2024.

This means that almost 10 million people are now breathing cleaner air, fewer children are growing up with stunted lungs and fewer people will have to suffer from asthma, dementia and heart disease, which means big savings for the NHS.

But whats is being done in the rest of the UK? Here’s a fairly up–to-date picture of air pollution initiatives in the UK: what’s been done recently, what is being planned, what goals are in place, and some of the challenges/status.

Key Government Strategies & Legal Targets

  1. Air Quality Strategy: Framework for Local Authority Delivery (England, 2023)

    • Published by Defra in April 2023; updated in August.

    • Sets out what local authorities are expected to do to improve air quality in their areas, especially for PM₂.₅ (fine particulate matter).

    • Legally binding UK-wide targets include:
      • An annual mean PM₂.₅ concentration of 10 µg/m³ by 2040, with an interim target of 12 µg/m³ by January 2028
      • A 35% reduction in average population exposure to PM₂.₅ by 2040, with a 22% reduction by January 2028, based on 2018 baseline.

  2. National Air Pollution Control Programme (NAPCP)

    • The UK has committed (under the Environment Act and pre-existing legal obligations) to reduce emissions of key pollutants including nitrogen oxides, sulphur dioxide, ammonia, and particulates. These are tied into domestic and international commitments. Local authorities are expected to use existing powers to help deliver on them.

  3. Clean Air Strategy & Clean Air Goals Based on WHO Guidelines

    • The UK government has made progress on aligning some goals with WHO guidelines. For example, it has committed to halve by 2025 the number of people living in areas that breach WHO guidelines on particulate matter.

    • The Clean Air Strategy remains the overarching framework for emissions from transport, industry, homes etc.


Local / Regional Measures & Examples

  1. London

    • Expanded Ultra Low Emission Zone (ULEZ) in 2023 to all London boroughs. Studies show substantial drop in NO₂ and particulate pollution since expansion.

    • Roll-out of air quality alerts: London has a system for forecasting pollution episodes; since 2018 there have been “high” and “moderate” alerts issued, and newest work includes notifying healthcare professionals directly.

    • Breathe London: network of hyper-local sensors (~400) to better monitor air pollution.

  2. Clean Air Zones (CAZ / Low-Emission Zones, Zero Emission Zones)

    • Oxford has the UK’s first zero emission zone (ZEZ) in its city centre, launched February 2022, and is increasing its charges.

    • Bradford’s Clean Air Zone (implemented Sept 2022) shows benefits: for e.g., savings to the NHS, reductions in pollution.

    • Other areas like York have local Air Quality Action Plans (AQAPs) involving measures like electric buses, increased charging infrastructure etc.

  3. Local Authority Support & Funding

    • The government has allocated funding (Air Quality Grant) to local authorities to deliver projects to improve air quality in their areas: schools, businesses, communities.

    • As of March 2025, there was a review (AQIS review) aimed at improving public awareness, making air quality more part of everyday conversation, improving information to at-risk groups.

    • In the West Midlands, a £1 million regional plan was launched covering things like real-time sensors, awareness campaigns, research into speed-limit reduction etc.

  4. Non-transport Sources & Broader Measures

    • Recognizing that transport isn’t the only source: homes (heating, boilers), industry, construction, shipping etc are also addressed. For example, London studies have shown that gas boilers are now a major source of NOₓ in central areas.

    • Port of London Authority (PLA) has an updated 2024 strategy, including tracking shipping emissions (using a Maritime Emissions Portal), working with vessel operators, exploring shore-side emissions, targeting hotspots.


Public Awareness & Regulatory Tools

  • The AQIS (Air Quality Information System) review published in March 2025 recommends better communication to the public: clearer explanation of health risks, better engagement with at-risk groups, schools, health sector.

  • Local Authorities are required to report via LAQM (Local Air Quality Management) portals etc. The Emissions Factors Toolkit has been updated.


Progress & Outcomes

  • Improvements seen in London since ULEZ expansion: NO₂ down substantially; particulate improvements.

  • Bradford clean air zone shows both pollution and health care cost benefits.

  • Many local authorities are developing or updating Air Quality Action Plans (e.g. York, Oxford etc).


Challenges & Gaps

  • Some delays and criticisms: for example, whether funding is sufficient and consistent. There are calls (from NGOs / coalitions) for a sharper, more enforceable Clean Air Act.

  • Achieving the stricter WHO guideline levels is hard, especially for PM₂.₅, which arises from many diffuse sources (some outside local authority control)

  • Non-transport sources like domestic heating / boilers, shipping, and industrial emissions are becoming proportionally more important as vehicle emissions fall – these present policy and technical challenges

  • Awareness still low in many places; some at-risk groups are still not well served by alerts / information. Communicating risk, and embedding air quality into planning / building / public health is a work in progress.

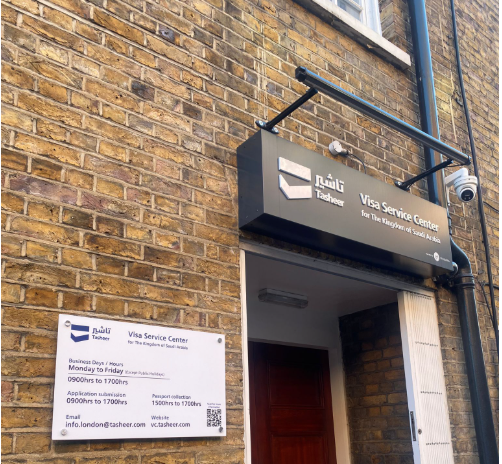
VISA privatisation in London

My recent experience with applying for VISAs at London based embassies, made we realised how many are privatised, appearing to be a global trend.  These privatised visa application centres have indeed expanded global access and added optional fast/comfort services — but they have also introduced new service fees and greater variability in speed and quality. Overall costs to travellers have risen in many places; processing times are mixed (sometimes faster for routine cases, often slower or unpredictable for complex cases or during provider transitions).

Country snapshots

India

  • Many foreign missions accept regular paper or VAC submissions through private operators (VFS, TLS, BLS etc.). The Indian government also uses VFS for handling some outbound visa/consular intake. Public notices show fixed service fees charged by the private operator on top of government visa fees (e.g. VFS service fees, or country-specific service charges).

  • Example of rising service charges: recent media reports show VFS and others periodically increasing service charges for Schengen/European applications from India (making the overall trip costlier). Applicants also pay extra for courier, SMS, premium lounges, assisted scanning.

  • Effect: applicants face higher out-of-pocket costs (govt fee + VAC service fee + optional extras). Speed: routine visa pickups / interview-waiver flows can be quick, but US and some other destinations still report backlogs and long waits in some Indian posts. 

China (applying to/from / applications handled in China)

  • Many consulates (EU states, UK, etc.) use TLScontact / VFS in China and publish a mandatory service fee charged by the VAC (examples: TLS pages showing service fee amounts in CNY). Processing times published by Chinese consulates (or the Visa for China service) often show regular, express and rush services with defined day counts (e.g. 4 working days regular, 2–3 days express ).

  • Impact: applicants in China commonly pay the consular visa fee + the VAC service fee (often mandatory) + optional extras. Where express/rush service is available it speeds up simple cases, but VACs occasionally report technical or transition delays which push processing out. 

Schengen area (representative: many EU countries outsource to TLS/VFS/BLS)

  • Many Schengen consulates outsource front-end tasks to private VACs. VACs collect a service fee (set in agreement with the consulate) and sell optional add-ons (courier, SMS, lounge). Recent reportage shows VFS raising its service charges for Schengen applications in some markets, increasing the total cost for applicants. 

  • Effect on timings: for routine short-stay applications, front-end outsourcing plus digital booking often reduces local queuing and can improve consistency — but back-end consular decision times and policy/seasonal backlogs still dominate final wait times. Transitions between providers sometimes cause appointment shortages. 

United States (how outsourcing of VACs interacts with US visa processing overseas)

  • The US State Department uses VACs (contractors) abroad for appointment scheduling, document drop-off and biometrics; the consulate/embassy still conducts interviews and decisions. State publishes wait times by post; those can swing widely by post and over time. Applicants pay the consular fee (MRV) and may pay for courier/VAC services in some posts. 

  • Effect: costs to applicants increased where VACs charge for service/courier; processing times depend on embassy appointment availability and local backlog (not only the VAC). Recent operational changes (e.g. restricting in-country appointments or provider changes) can lengthen waits and increase travel costs for applicants.

Evidence on costs rising after privatisation

  • UK example (well-reported): investigations found the Home Office’s average revenue per overseas visa application rose sharply after outsourcing to VFS — reported figures show an increase from about £28.73 → £122.56 average per application over several years (largely driven by promoted add-on services and changes in fee structures). This is widely cited as evidence that outsourcing created new revenue/fee pathways.

  • Direct VAC service fees are common and documented in many countries (e.g. TLS/VFS pages listing mandatory service fees in China, India notices requiring service fees). Media pieces and VAC notices show explicit increases in service charges in some markets (e.g. VFS hikes for Schengen applicants from India). Together these add materially to the total cost for travellers.

Evidence on processing times (short answer)

  • Mixed. Digitisation + VAC networks improved front-end convenience (online booking, document drop, biometrics), which can speed some routine cases. But back-end decision times (security checks, complex eligibility assessments) and supply constraints (appointment availability, provider transitions) often keep or increase total wait times for many applicants. Published wait-time pages (e.g. U.S. State Dept, local consulates) reflect that variability. 

Privatisation/outsourcing of visa front-end services has delivered better geographic coverage, more online conveniences and optional rapid services — but it has also introduced new mandatory and optional fees, more upselling, and variability in service quality. Empirically, costs to applicants have increased in many places after outsourcing (UK is a clear documented example; similar fee structures and increases are evident for VACs in India, China and Schengen posts). Processing times improved for some routine cases but remain unpredictable for many applicants.


Beijing Air Quality improvements since 2008 Olympics

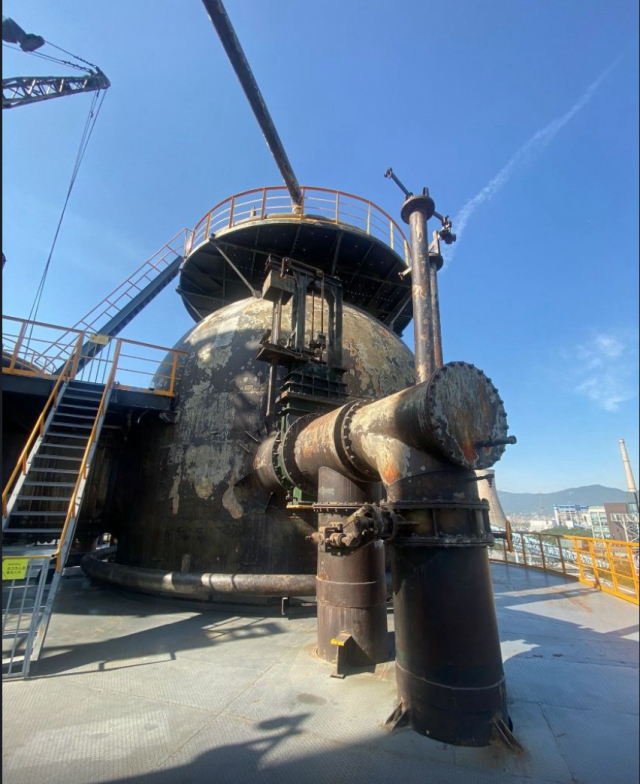
Remnants of Shougang Steel plant in Beijing which has been decommissioned; steel production moved from the City and turned into an industrial Park where the air quality is visible much better

Remnants of Shougang Steel plant in Beijing which has been decommissioned; remaining steel production moved from the City and turned into an industrial Park where the air quality is visible much better now.

Beijing’s air quality has significantly improved since the 2008 Olympics, driven by government initiatives, with PM2.5 levels dropping by more than 50% and contributing to an increase in life expectancy. The Olympics spurred temporary measures and long-term policies like the Beijing Clean Air Action Plan (2013-2022), which involved relocating industries, increasing green energy, reducing traffic emissions, and strict environmental regulations, leading to sustained “Beijing Blue” skies.

During the 2008 Games, we had a host of temporary “Olympic Blue Skies” measures resulted in significantly lower air pollution levels, with the Air Pollution Index (API) 36% lower than the average of the preceding eight years.

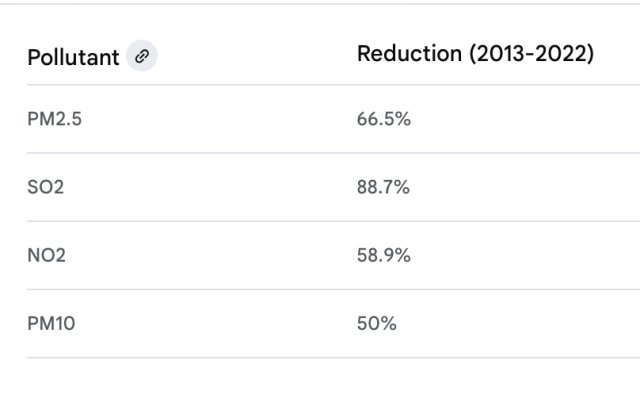
After the temporary controls we had sustained progress, and most significantly between 2013 and 2020, Beijing’s PM2.5 levels dropped from 85 μg/m³ to 38 μg/m³, a decrease of over 50% along with other pollutants as listed below; 

The Olympics acted as a catalyst for major government action and in particular the Beijing Clean Air Action Plan (2013-2022). This major program focused on:
Relocating, closing, or cleaning up polluting industries; increasing green energy generation; reducing emissions from traffic and extensive reforestation.

We also had stricter regulations as a revised Environmental Protection Law in 2015 introduced the most stringent regulations to date for preventing and controlling air pollution nationally and locally.

Also regional coordination, as we saw coordinated efforts across the Beijing-Tianjin-Hebei region contributed to lower PM2.5 levels between 2013 and 2017.

And on the infrastructure and energy front, China has worked to switch coal-fired boilers to gas and has significantly expanded its public transportation network, including subways and bus lines, to reduce traffic emissions.

Finally the reduction in air pollution has directly benefited the health of Beijing residents. Research by the EPIC has shown that this improvement is linked to an increase in life expectancy for Beijing residents.


Top 10 transit authorities for transport decarbonisation


On my travels to global cities around the world, would you believe it, l often look out for their transit authorities efforts to decarbonise transport in their cities. Below you will find how l rank them in their efforts and achievements; 

1) Shenzhen Bus Group (Shenzhen, China)Score: 9.5 / 10

Its the first city to fully electrify its entire bus fleet, thats 16,000 bus fleet, all completed by end-2017 — with large charging infrastructure rollout and clear operational lessons in scale. This is a textbook case of rapid fleet electrification at scale.

2) Stockholm SL (Stockholm, Sweden / SL region)Score: 9.0 / 10

Public transport running on 100% renewable electricity since 2017 covering all its trains & trams, has strong city net-zero planning and pilots (electric ferries, zero-emission zones) as well. Excellent combination of electrified modes + renewable supply.

3) RATP / Île-de-France (Paris region, France)Score: 8.8 / 10

Has very ambitious bus programme (Bus2025) delivering thousands of “clean” buses — a sizeable share electric + bio-methane — plus depot modernisations to host EVs and renewable fuels at scale. Strong near-term reductions and local air-quality wins.

4) MTR (Hong Kong)Score: 8.5 / 10

With SBTi-level corporate credibility validating its targets for parts of its business, strong energy efficiency and renewable sourcing in property + rail (rail is inherently electric) Thus it has a good whole-system corporate approach.

5) TfL (London)Score: 8.2 / 10

With SBTi validation (Apr 2025) + aggressive bus electrification of  between 1,900 to 2,000 zero emissions buses as of 2024–25. Plus an active PPAs  with solar deals and a 2030 renewable electricity target. Big consumer scale creates challenges, but ambition and verified targets put TfL among leaders.

6) LTA / Singapore (national procurement & operators)Score: 8.0 / 10

It has centralised planning and targets of 50% e-buses by 2030 and 100% cleaner energy buses by 2040, major procurement waves, depot power planning and national coordination — a model for aligning grid  and vehicles.

7) Seoul Metropolitan (Seoul, South Korea)Score: 7.8 / 10

Has a rapid adoption of hydrogen & electric buses with big national subsidies and plans (large tenders for hydrogen buses), strong municipal leadership and financing support. Rapid rollouts but technology mix varies.

8) BVG (Berlin, Germany)Score: 7.4 / 10

Its subways & trams running on green electricity since mid-2010s and active bus electrification plans (substantial e-bus purchases + new e-depots planned). Solid European model with a strong grid/renewables focus.

9) Tokyo Metro / Japan operatorsScore: 7.0 / 10

Its rail systems are already electric (low direct CO₂ per pax), Tokyo operators emphasise energy efficiency and renewable procurement; grid and policy context make further cuts possible though national timelines are longer.

10) MTA (New York, USA)Score: 6.6 / 10

It has huge system-scale opportunities (many electric rail fleets) but bus electrification and depot/grid upgrades are slower due to funding & logistical scale; robust plans exist but delivery lags behind top performers.

My quick, evidence-backed takeaways are as follows;

  • Mass electrification leaders are mostly in Asia and Northern Europe. Shenzhen’s full bus electrification (2017) remains the single most advanced practical deployment case. 

  • Renewable electricity sourcing + verified targets matter. Stockholm’s 100% renewable electricity for public transport (and TfL’s SBTi validation) are powerful accelerants because electrified services only deliver low-carbon outcomes if the electricity is clean. 

  • Central coordination speeds delivery. Singapore’s model (LTA) — national tenders, depot power planning and integrated procurement — reduces the “buses arrive before chargers” problem many fragmented procurement models face. a.gov.sg

  • Hybrid pathways can be pragmatic. Paris used electric + renewable gas (bio-methane) to deliver rapid local emissions and air-quality benefits before 100% battery rollouts were practical. That reduced near-term emissions while building EV infrastructure.

If you want to find out move of how l scored these transit authorities and my sources which do get in touch. We will have much to discuss, no doubt. 

Tesla Cars – what we need to know now

Let us be clear from the outset, driving a Tesla does not mean someone supports fascism.
But when scholars and critics talk about “links” between Tesla and fascism, they’re usually referring to cultural patterns, leadership style, labor relations, and political signalling — not the vehicles themselves.

Firstly the cult of personality is a feature. Fascism historically thrives on charismatic leaders, with strong emphasis on individual authority. Elon Musk has cultivated a persona as a visionary, genius innovator — many Tesla fans treat him almost like a political leader rather than just a CEO. Critics argue that this cult of personality around Musk can echo dynamics seen in fascist movements (though obviously not identical).

Then we have the techno-utopianism and authoritarianism as Tesla promotes a future centred on high-tech solutions  ie self-driving cars, Mars colonisation, AI. Some scholars argue that certain strands of fascism embraced a similar “futurist” worship of technology, speed, and industry, often tied to authoritarian control. The idea that society’s problems can be solved by a visionary elite with advanced technology, rather than democratic debate, resonates with critiques of technocratic authoritarianism holds strong as well. 

As for labour and control, fascist regimes historically suppressed labor unions and promoted top-down corporate control. Tesla has been repeatedly criticised for union-busting, punishing whistleblowers, and maintaining highly controlled workplaces. These practices aren’t unique to Tesla, but they fit into a broader critique of corporate authoritarian tendencies.

As for nationalism and identity, Tesla markets itself as a symbol of American ingenuity and dominance in EVs, which can resonate with nationalist narratives. While Tesla cars are global, some fans treat them as status symbols of Western/US technological superiority. Fascism often elevates technological power as a marker of national greatness.

Then we have online culture and political alignment. Here Musk’s recent political leanings and online behaviour (especially on X/Twitter) have aligned more with far-right figures and movements, some of which flirt with or openly embrace fascist rhetoric as we have seen on matters in the UK. This has bled into Tesla’s image: some critics view the company and its fanbase as increasingly tied to reactionary or authoritarian politics.

And finally it has  aesthetic parallels. Fascism historically used sleek, modern design and celebrated cars/aviation as symbols of progress and power (think of Italy’s Futurism movement). Tesla’s minimalist, futuristic aesthetic taps into similar cultural motifs of speed, control, and technological destiny.


All these arguments, frankly should make us all very weary of buying into Tesla. 

The state of Religious Education today!

What on earth was Valentina Gomez going on about at the right-wing rally on Saturday along Whitehall? It is bad enough that we had to tolerate such a march going through Central London but for her to come up with all this islamophobia was incredible. Why is she even getting a stage at all here?

Seriously someone also needs to tell her Jesus Christ (known as Isa) is mentioned 78 times alone in the Koran and Moses ( known as Musa) over 100 times. Jesus Christ is considered one of God’s greatest messengers to humankind and the Messiah as well. Clearly she does not known that Islam is an Abrahamic faith and the belief in one god,  so closely related to Judaism and Christianity. Clearly the state of religious education is awful in the US and probably the UK, if people don’t understand this at all.